Understanding Current Trends in the Housing Market
The housing market is undergoing significant changes, affecting everyone from homeowners and renters to real estate professionals. A recent survey conducted by ResiClub reveals valuable insights into these shifts, especially as the national dynamic continues to transition from sellers to buyers.
The Importance of Monitoring Active Listings
When evaluating home price trends, active listings and the months of supply are critical metrics. A surge in active listings coupled with longer market durations often suggests a decline in pricing strength. Conversely, a rapid decrease in active listings may indicate a robust market.
Active Listings vs. Market Strength
- Increasing Active Listings: Possible sign of market softening.
- Decreasing Active Listings: Indicative of a tightening or heating market.
The Shift from Sellers to Buyers Post-Pandemic
Following the pandemic-induced housing boom that peaked in 2022, the power dynamics in the housing market are slowly shifting:
- National Trends: The balance has shifted from sellers to buyers in various regions, albeit unevenly across the country.
- Local Variations: Markets where active inventory exceeds pre-pandemic levels have seen stagnant or declining home prices, while areas with less inventory have experienced stronger price resilience.
Inventory Trends Into 2025
ResiClub forecasts that by the latter half of 2025, national active inventory will approach pre-pandemic levels. As of now, active listings increased by 28.9% from June 2024 to June 2025, indicating a broader reach for homebuyers.
Current Inventory Status
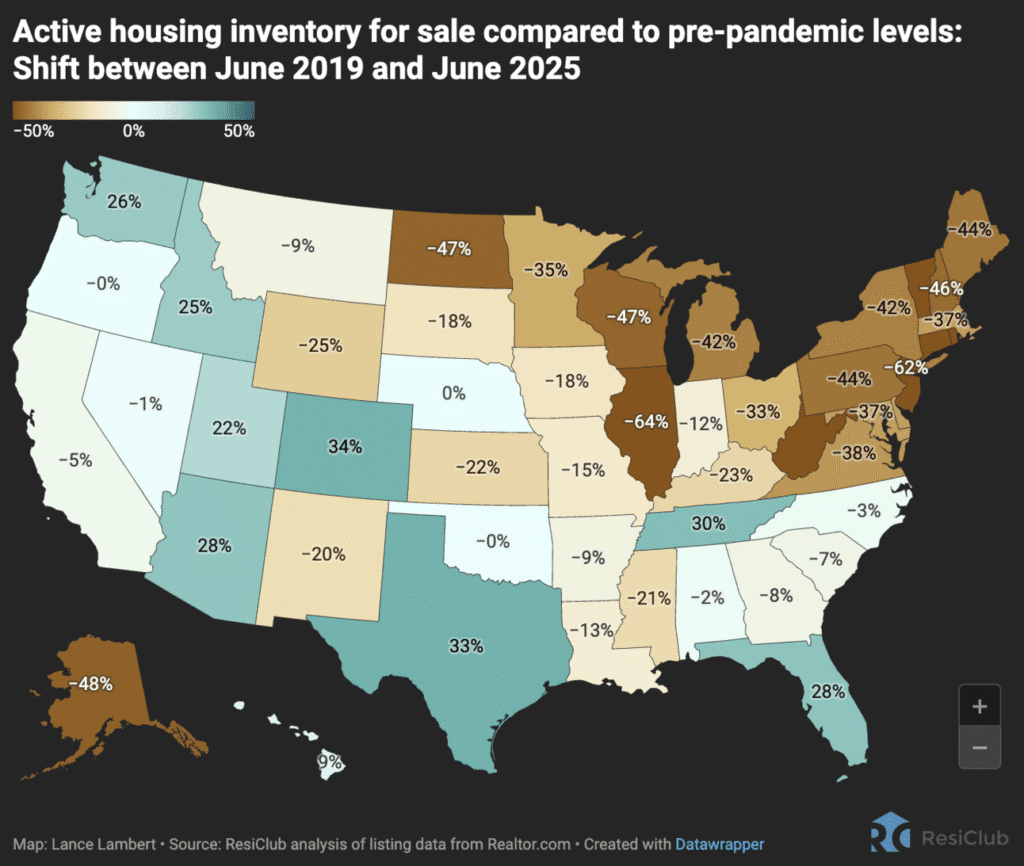
Compared to June 2019, active listings are still 11.3% lower. However, certain markets, especially in the Midwest and Northeast, remain tight.
Year-over-Year Active Listings: A Closer Look
Active listings from June data over the years have shown interesting trends:
- June 2017: 1,292,371
- June 2018: 1,216,504
- June 2019: 1,219,807
- June 2020: 871,557
- June 2021: 492,425 (Pandemic boom peak)
- June 2022: 573,650
- June 2023: 614,326
- June 2024: 839,992
- June 2025: 1,082,520
Predicted Growth
- June 2026: Estimated 1,325,048 active listings
- June 2027: Estimated 1,567,576 active listings
Current Housing Market Analysis
According to ResiClub, while active inventory is generally rising, various markets still exhibit tightness, particularly:
- Midwest and Northeast: Limited new resale and home inventory keeps seller advantages.
- Sun Belt and Mountain West: Inventory nearing or surpassing pre-2019 levels, sustaining a more competitive buyer’s market.
Regional Price Softening
Many areas that benefited from price surges during the pandemic are now grappling with market adjustments. For instance:
- Florida and Texas experienced significant inflation in home prices, now facing challenges due to rising mortgage rates and slowed migration driven by pandemic conditions.
Market Weakness and the Lock-In Effect
While inventory rises, the so-called “lock-in effect” may contribute to a reluctance among homeowners to sell, fearing substantial increases in mortgage payments. However, the number of new listings has revived, pointing towards potential stability in the market.
The Future Outlook
New listings in 2025 show an uptick compared to previous years. If this trend continues without corresponding sales, active inventory could further rise, exerting pressure on market prices:
- Potential Impacts: Increased active inventory without matching sales could lead to additional price adjustments.
Conclusion: What Lies Ahead?
As the housing market continues to evolve, staying informed is critical. Understanding active inventory and market dynamics can equip buyers and sellers with the necessary insights to make informed decisions. In a landscape where trends shift rapidly, keeping a close eye on these vital statistics is more important than ever.
For ongoing updates and comprehensive analysis of housing markets, consider following ResiClub for expert opinions and data trends.


